LAND AND EMIGRATION COMMISSIONERS.
41
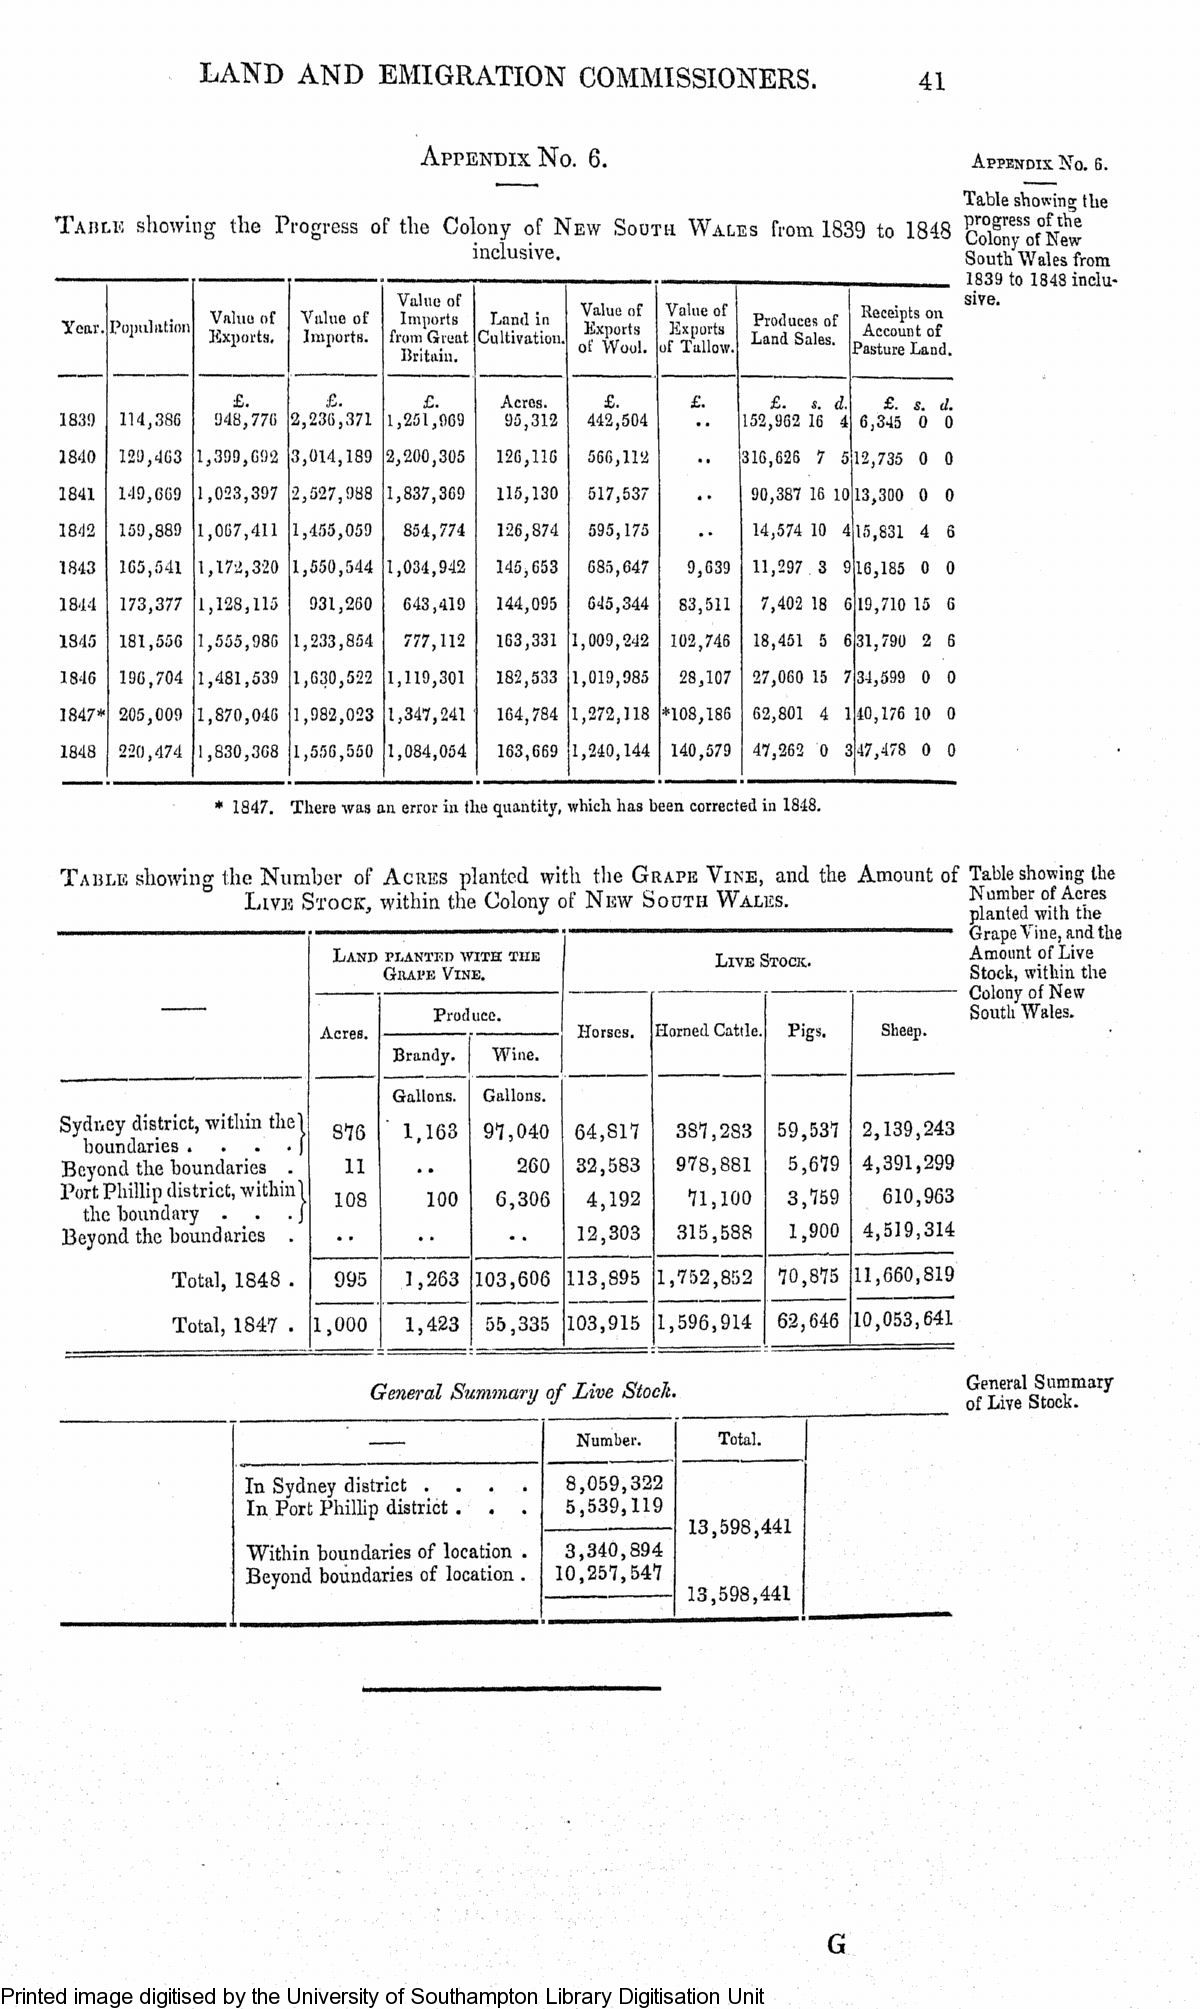
Appendix No.
6.
Table showing the P rogress of the Colony of New South Wales from 1839 to 1848
inclusive.
Year.
Population
1839 114,386 1840 129,463 1841 149,(569 1842 159,889 1843 165,541 1844 173,377 1845 181,556 184G 196,704 1847* 205,009 1848 220,474
Value of Exports.
£.
948,776 1,399,092 1,023,397 1,067,411 1,172,320 1,128,115 1,555,986 1,481,539 1,870,046 1,830,308
Value of Imports.
Value of Imports from Giuat Britain.
Land in Cultivation.
Value of Kxpotts of Wool.
JC.
2,236,371
£.
1,251,909
Acres.
95,312
£.
442,504 3,014,189 2,200,305 126,116 566,112 2,527,988 1,837,369 115,130 517,537 1,455,059 854,774 126,874 595,175 1,550,544 1,034,942 145,653 685,647 931,260 643,419 144,095 645,344 1,233,854 777,112 163,331 1,009,242 1,030,522 1,119,301 182,533 1,019,985 1,982,023 1,347,241 164,784 1,272,118 1,556,550 1,084,054 163,669 1,240,144
Value of Exports of Tallow.
Produce1?
of Land Sales.
Receipts on Account of Pasture Land.
£.
£.
s.
d.
152,962 16 4
£.
s.
d.
6,345 0 0
..
316,626 7 5 12,735 0 0
•• 90,387 16 10 13,300 0 0
•• 14,574 10 4 15,831 4 6 9,639 11,297 3 9 16,185 0 0 83,511 7,402 18 6 19,710 15 6 102,746 18,451 5 6 31,790 2 6 28,107 27,060 15 7 34,599 0 0 *108,186 62,801 4 1 40,176 10 0 140,579 47,262 0 3 47,478 0 0
Appendix No.
6.
Table showing the progress of the Colony of New-South Wales from 1839 to 1848 inclu¬ sive.
* 1847.
There was an error in the quantity, which has been corrected in 1848.
Table showing llio Number of Acres planted with the Grape Vine, and the Amount of
Live Stock, within the Colony of New South Wales.
Land planted with the
Giiai'E Vine.
Live Stock.
Acres.
Produce.
Horses.
Horned Cattle.
Pigs.
Sheep.
Brandy.
Wine.
Sydney district, within thel boundaries ....
J Beyond the boundaries .
Port Phillip district, within!
the boundary .
.
.J
Beyond the boundaries .
876 11 108
Gallons.
1,163
100
Gallons.
97,040
260 6,306
64,817 32,583 4,192 12,303
387,283 978,881 71,100 315,588
59,537 5,679 3,759 1,900
2,139,243 4,391,299 610,963 4,519,314 Total, 1848 .
995 1,263 103,606 113,895 1,752,852 70,875 11,660,819 Total, 1847 .
1,000 1,423 55,335 103,915 1,596,914 62,646 10,053,641
Table showing the Number of Acres planted with the Grape Vine, and the Amount of Live Stock, within the Colony of New South Wales.
General Summary of Live Stock.
In Sydney district ....
In Port Phillip district .
.
.
Within boundaries of location .
Beyond boundaries of location .
Number.
8,059,322 5,539,119 3,340,894 10,257,547
General Summary of Live Stock.
Total.
13,598,441 13,598,441
G